

From time to time it is necessary to develop custom .NET code and call it from Dynamics AX. It could be that you already have the .NET code to do what you need and you don’t want to reimplement the functionality in X++, or what you are trying to do is too complex to do directly in X++.
One common situation is where you need to write a wrapper around some operating system functionality or web service to expose a much simpler API to AX.
This works, and AX has good support for calling .NET code through it’s .NET interop framework. One thing that does become more complicated is debugging, but once you know how it is actually quite easy.
Visual Studio
In order to debug .NET assemblies you will need Visual Studio. If you’re developing your own .NET code you will most likely have this already, and the steps shown here should work with any recent version of Visual Studio. I have done this with Visual Studio 2013 as well as 2015.
Compiling your assembly
First of all, make sure you have selected a debug configuration and then compile your .NET assembly. In your output folder you’ll find your DLL along with a PDB file. These need to be copied to your Dynamics AX client bin folder, typically located at C:\Program Files (x86)\Microsoft Dynamics AX\60\Client\bin.
If your project has references to other assemblies, such as Microsoft Exchange Managed API or similar, the required DLLs and their PDB files will also be copied to your output folder. In that case, make sure that these are also copied to the AX client folder.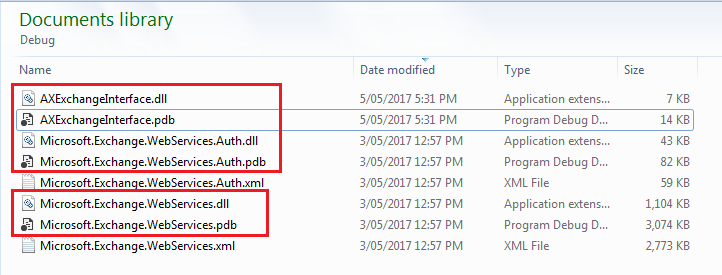
For a redeployment, you would only need to copy the assembly DLL and PDB for what has actually changed. The referenced Exchange API assemblies would not have changed and can be ignored when you redeploy.
Adding reference and code to the AX side
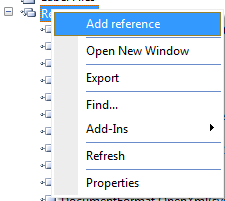
In the AX development environment, add a reference to your assembly. Right-click on the References node in the AOT and select Add reference:
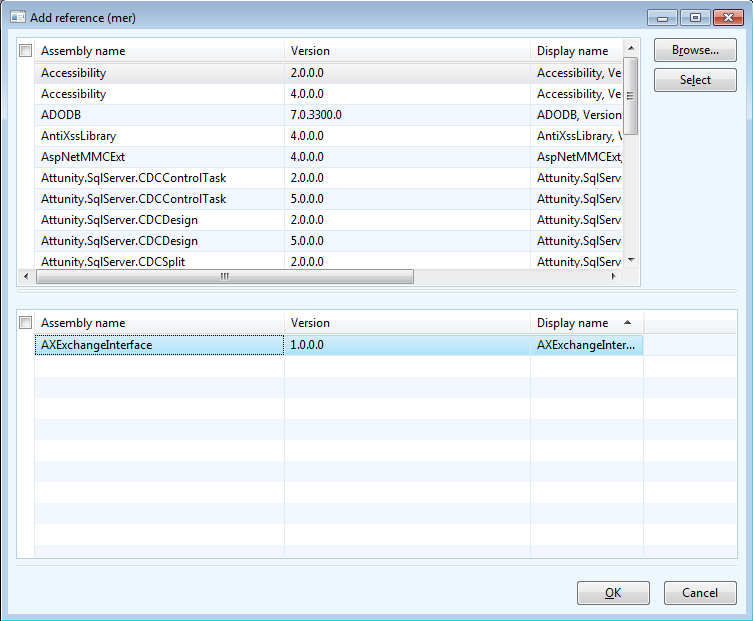
Click Browse and select the DLL you copied to the AX client folder. The assembly will show up in the bottom half of the form:
It is not necessary to add references to assemblies referenced by your DLL. The .NET runtime will take care of that automatically, the DLLs just need to be in the same folder or in the Global Assembly Cache.
After you have done this, restart the AX client.
Write some code to test the assembly
For this demonstration, let’s just write a small job to test the assembly:
static void EB_TestDebugger( Args _args )
{
  AXExchangeInterface.ExchangeInterface exchangeInterface;
  int      numEmails;
  int      i;
  Filename tempFileName;

  new InteropPermission( InteropKind::ClrInterop ).assert();

  tempFileName      = WinAPI::getTempFilename( WinAPI::getTempPath(), "AXPDF" );
  exchangeInterface = new AXExchangeInterface.ExchangeInterface( "user@domain.com" );
  numEmails         = exchangeInterface.LoadEmails();

  for( i = 0; i < numEmails; i++ ) // .NET is using zero-based indexes
  {
    if( exchangeInterface.GetAttachment( i, tempFileName ) )
    {
      // Do something with it
    }
  }

  CodeAccessPermission::revertAssert();
}
Nothing fancy, just asserting CLR interop permissions, creating a CLR object from a class in the assembly, then call some simple API methods on it before we revert the CLR interop permissions assert.
Don’t run the job just yet. We’ll need to attach the debugger first, but before that I strongly recommend to run with only a single instance of the Dynamics AX client. It will make it a lot easier to select the correct process to attach to.
Attaching the debugger
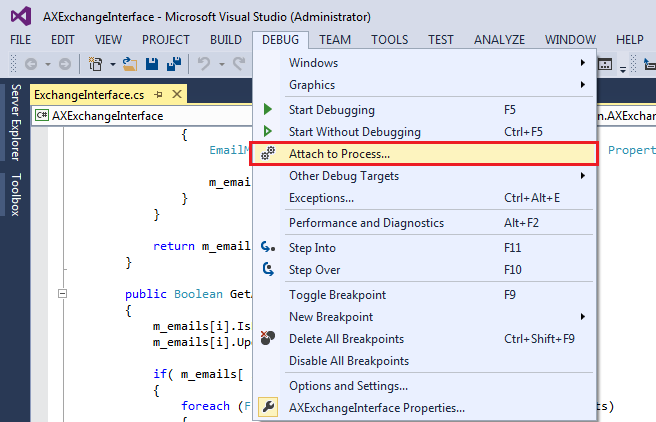
Back in Visual Studio, with your .NET assembly project open, set breakpoints in your code where you want them. When you are ready to start debugging, click DEBUG and then Attach to Process.
In the form that opens, find and select your Dynamics AX client process. It will be named ax32.exe.
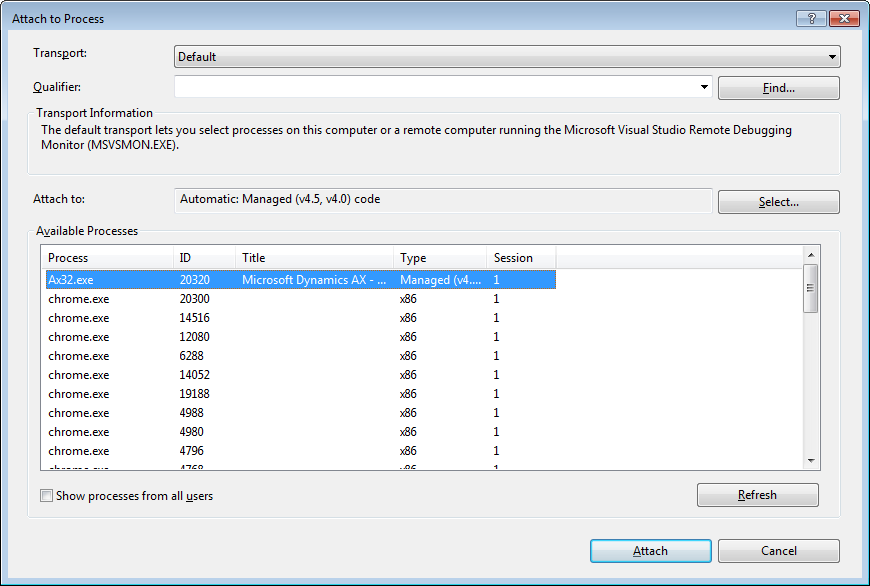
It is possible to use Visual Studio to debug processes running on remote computers as well, but let’s leave that complexity out of it for now. Click the Attach button to attach to the AX client process.
Have a look at the breakpoints you set earlier. If they appear red like normal, everything is good and debugging should work well. If they are just a red ring with white center, the AX client has not loaded symbols for your assembly which usually means that the assembly has not been loaded, either.
Good: 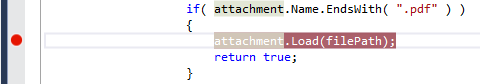 Bad:
Bad: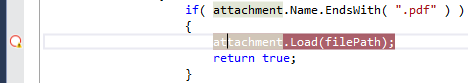
If the breakpoints are not lighting up correctly, detach from the AX client process again (Don’t choose terminate…) and start troubleshooting what could be wrong:
- The assembly has not been built with debug information. Are you sure the assembly was built in a debug configuration?
- There is another version of the same assembly in the GAC. Use GACUtil.exe to search for and remove the assembly if present.
- The current version of the DLL and PDB (you’ll need both…) files have not been copied to the AX client folder, so AX loaded up an old version.
- Did you connect to the correct ax32.exe process? On some development workstations there could be several of them. I recommend running with only a single client process when debugging with Visual Studio.
Anyway, assuming that the breakpoints did indeed light up as they should, you can now run the job from earlier.
When execution hits your breakpoint, the Visual Studio debugger will fire up and you can debug and inspect as with any other .NET program. You can even use the AX debugger to step through your code, and it will seamlessly hand over to Visual Studio whenever a breakpoint is hit within the .NET code.
Sweet as…
Changing the assembly and trying again
If you need to make changes to the .NET code and try again, you’ll need to stop the AX client before you copy the new version of the DLL and PDB file across to the client bin folder. Otherwise AX will keep the assembly loaded, both preventing you from overwriting the existing files, and from loading a new version.